


What is ELK?
The ELK stack is an open-source software collection that provides a powerful and versatile toolset for log management and analytics. It consists of three main components:
Elasticsearch
Elasticsearch is a search engine built on top of Apache Lucene. It’s built on top of the JVM and can ingest vast amounts of data. It provides rich search capabilities. You can do free text search over all fields on the document. Additionally, you can do more structured queries, where you combine search operators limited to specific fields in whatever way you like. Some categorize it as a NoSQL database.
While Elasticsearch is a complex beast, two elements in its design are relevant for us:
- Index: An index is a logical partition containing documents, similar to a table in a relational database.
- Document: Documents are the base unit of storage inside Elasticsearch. A JSON document containing keys and fields of different types stores the relevant information.
Typically, you interact with it through its comprehensive API. A sample query looks like this:
GET /_search
{
  "query": {
    "query_string": {
      "fields": [
        "title",
        "content"
      ],
      "query": "this OR that OR thus",
      "type": "cross_fields",
      "minimum_should_match": 2
    }
  }
}
Logstash
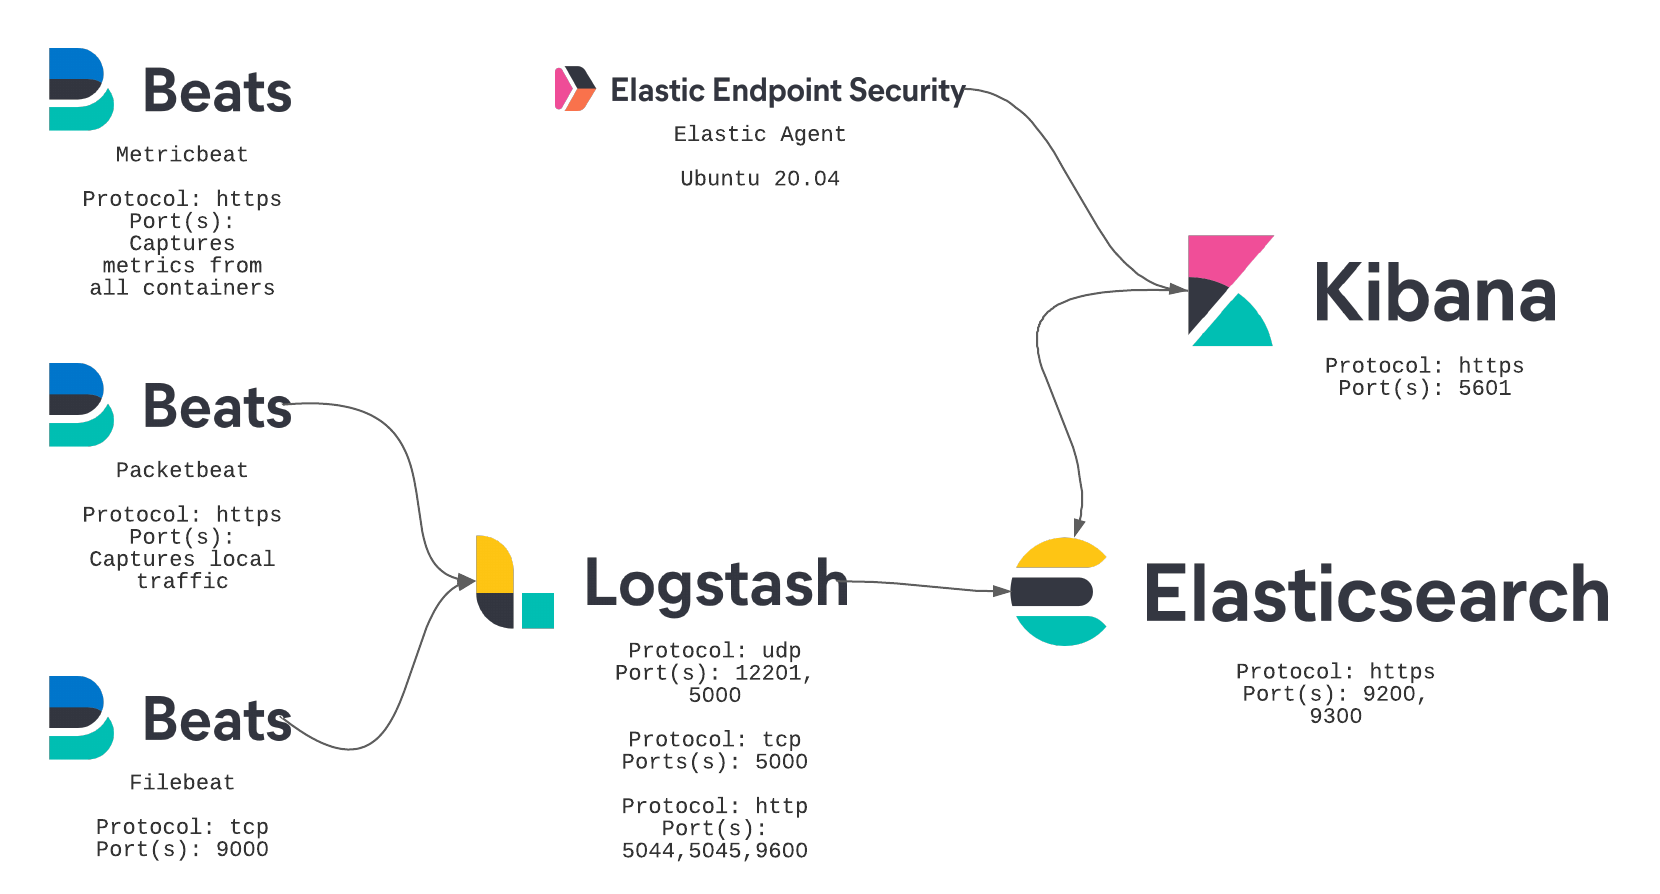
Logstash ingests logs from multiple sources. It collects logs, transforms them, and then sends them to the desired location.
Logstash has a rich plugin ecosystem to enhance its capabilities, like adding more inputs, outputs, or new transformations. You configure it with a DSL like this:
apache.conf
input {
  file {
    path => "/tmp/*_log"
  }
}

filter {
  if [path] =~ "access" {
    mutate { replace => { type => "apache_access" } }
    grok {
      match => { "message" => "%{COMBINEDAPACHELOG}" }
    }
    date {
      match => [ "timestamp" , "dd/MMM/yyyy:HH:mm:ss Z" ]
    }
  } else if [path] =~ "error" {
    mutate { replace => { type => "apache_error" } }
  } else {
    mutate { replace => { type => "random_logs" } }
  }
}

output {
  elasticsearch { hosts => ["localhost:9200"] }
  stdout { codec => rubydebug }
}
Kibana
Kibana is the visual layer on top of Elasticsearch. As mentioned, Elasticsearch is heavily API-based. Kibana helps developers with two tasks: exploring logs and building visualizations.
Exploring logs usually starts with a developer trying to figure out a problem and searching through logs. For instance, if you look at the screenshot below, you can see the developer might be interested in finding all the redirects occurring in the application. Filtering by field, grouping the results, or controlling the time range for the query are other options. Kibana provides a graphical interface to do all this conveniently.
Source: https://www.loggly.com/use-cases/what-is-the-elk-stack/
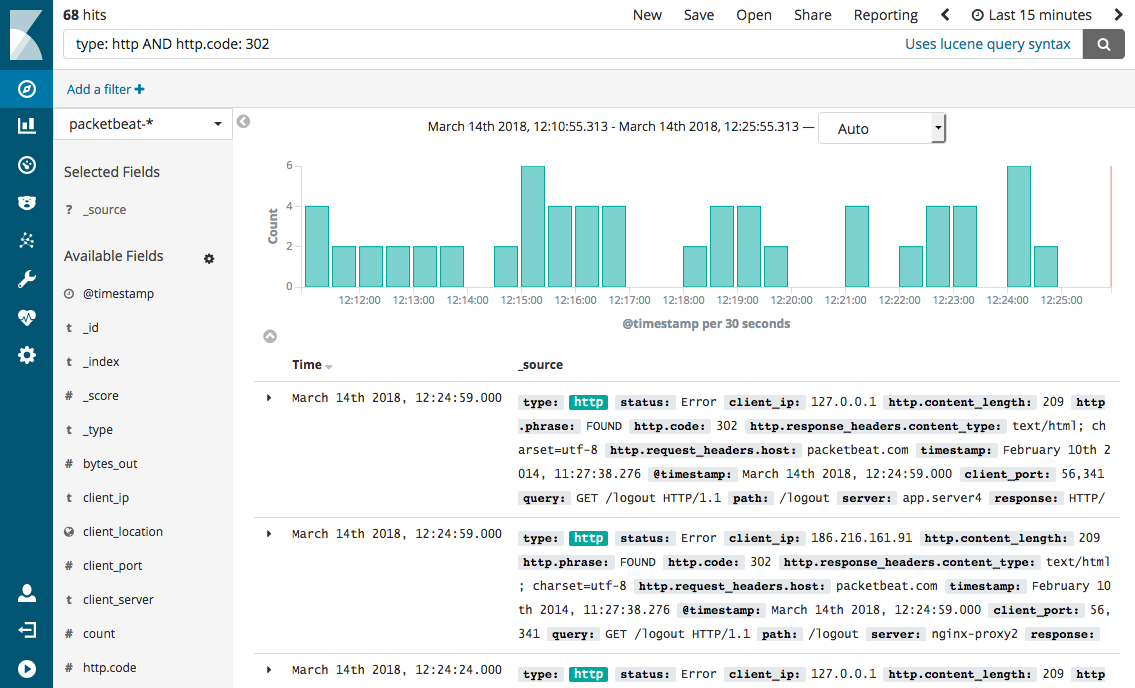
Source: https://www.elastic.co/guide/en/beats/packetbeat/current/kibana-queries-filters.html
The second important aspect of Kibana relates to visualization. Building dashboards out of crucial metrics is very helpful because it distills the information into something visual and consumable by anybody in the organization, not just the person who initially created it.
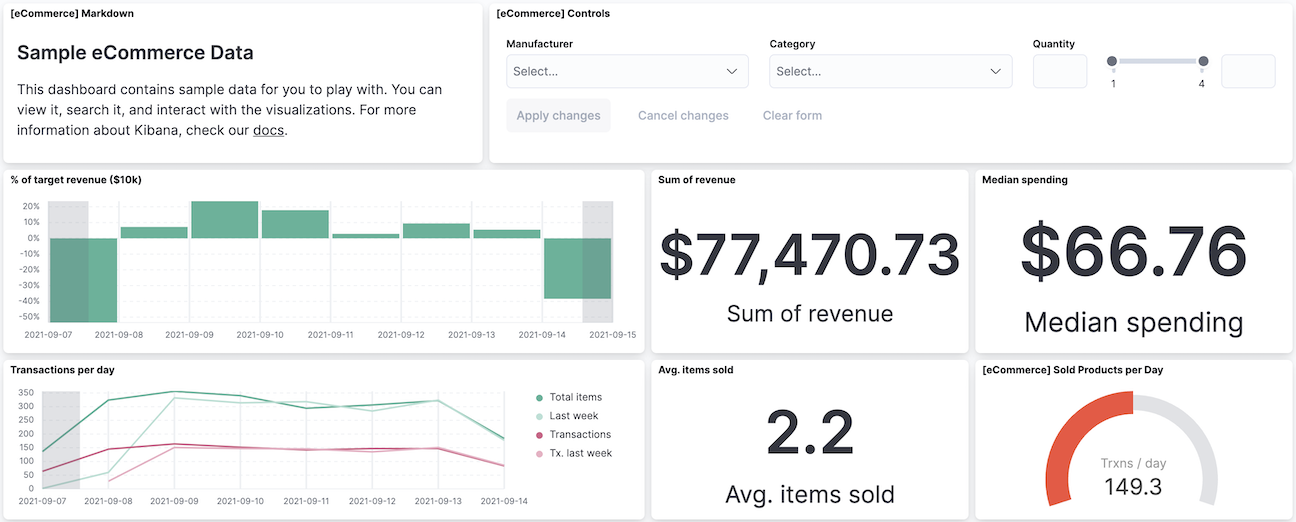
Source: https://www.elastic.co/guide/en/kibana/current/dashboard.html
Benefits of using the ELK stack
- Centralized log management:The ELK stack allows you to collect and store log data from all of your systems and applications in a central location. This makes it easier to monitor your entire environment and troubleshoot problems quickly and efficiently.
- Real-time analytics: The ELK stack can index log data in real time, so you can analyze your logs and identify trends and patterns as they happen. This can help you to detect and respond to security threats more quickly.
- Powerful search capabilities: Elasticsearch is a highly scalable search engine that can handle large volumes of log data with ease. This makes it easy to search for specific log entries or patterns.
- Interactive dashboards: Kibana provides a variety of pre-built dashboard templates that you can use to visualize your log data. This makes it easy to see trends and patterns in your data, and to identify potential problems.
Examples of how the ELK stack can be used
Application performance monitoring
The ELK stack can be used to monitor the performance of your applications by tracking log entries related to resource usage, errors, and latency. This information can be used to identify and troubleshoot performance bottlenecks.
Security monitoring
The ELK stack can monitor your systems for security threats by tracking log entries related to suspicious activity, such as unauthorized access attempts or malware infections. This information can be used to detect and respond to security threats more quickly.
Troubleshooting
The ELK stack can be used to troubleshoot problems by searching for log entries that may be related to the problem. This information can be used to identify the root cause of the problem and to implement a fix.
Here are some additional reasons why the ELK stack is important for systems:
- It is scalable: The ELK stack can be scaled to handle large volumes of log data from even the most complex systems.
- It is flexible: The ELK stack can be used to monitor and analyze a wide variety of log data, including system logs, application logs, and security logs.
- It is open source: The ELK stack is open-source software, meaning it is free to use and modify.
- It has a large community: The ELK stack has a large and active community of users and contributors. This means that there is a wealth of documentation, support, and training available.
If you are looking for a powerful and flexible tool to improve your system monitoring and security, the ELK stack is a great option.
This post is definitely gonna help me down the line , so I’m so grateful for that 🙂